
Where: Portfolio in the left-hand navigation. The page is marked Read only: the fund manager runs the portfolio and you follow it.
Portfolio header
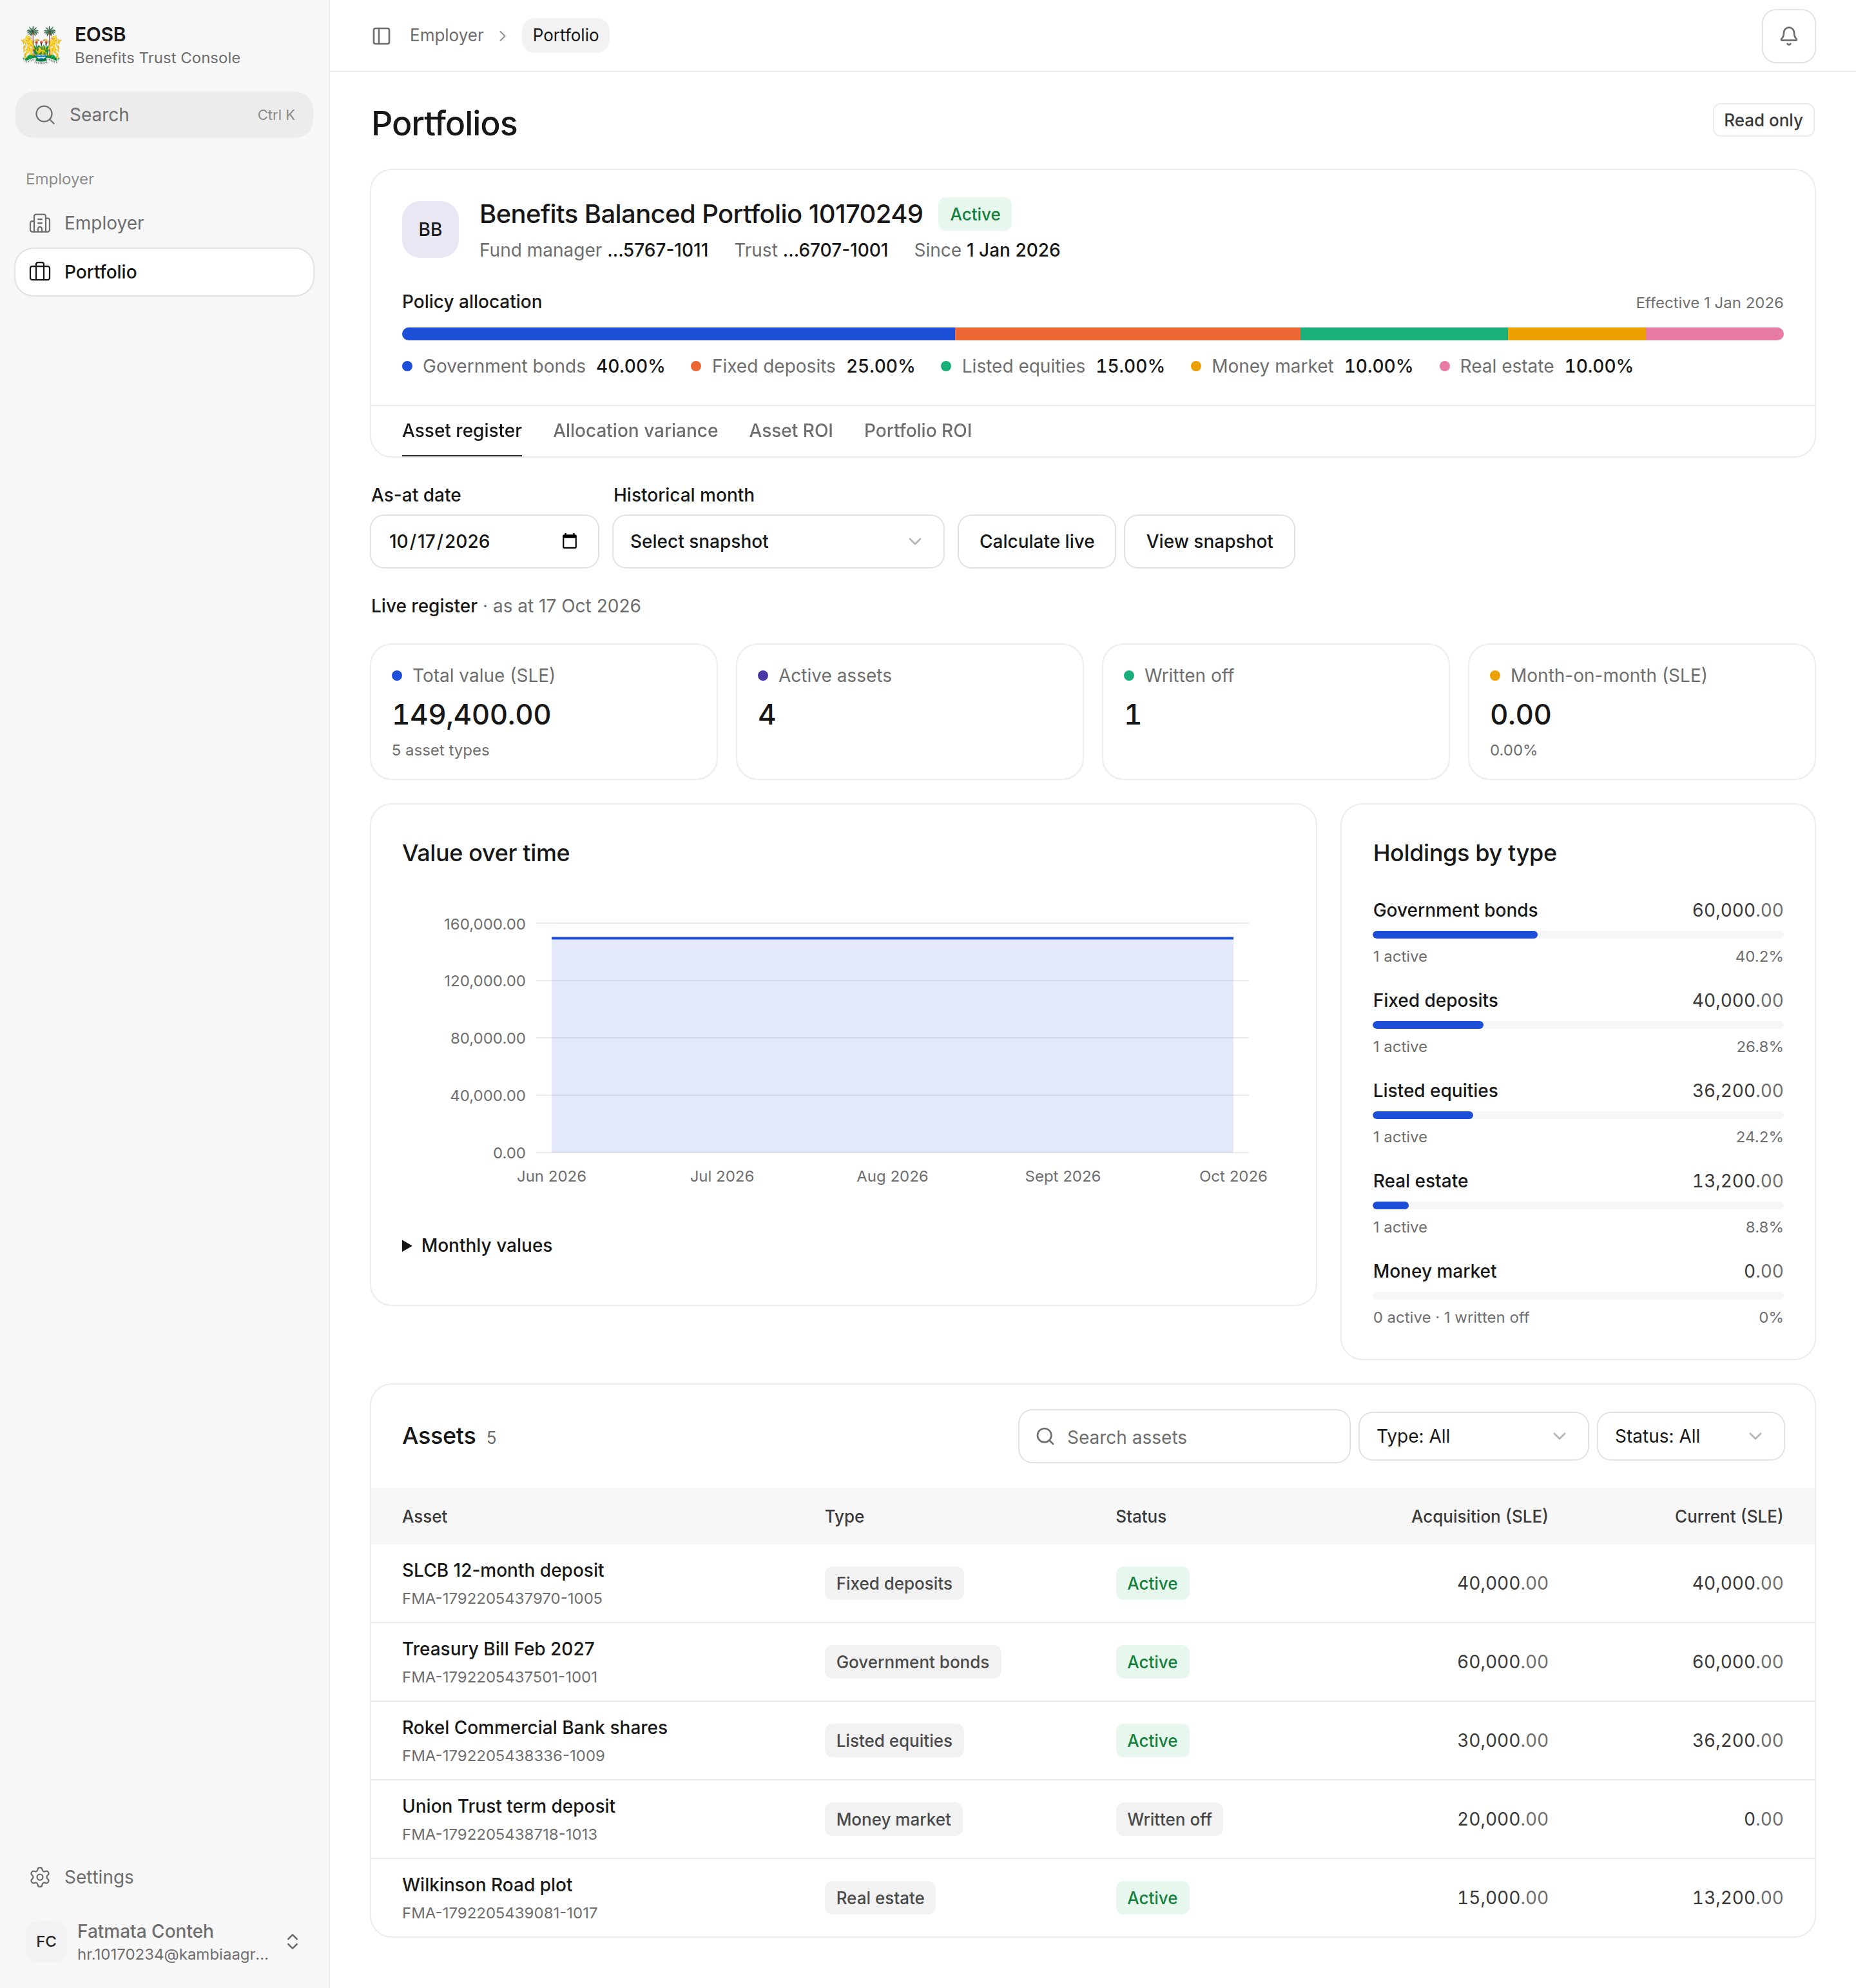
The asset register
Asset register
What the portfolio holds.- As-at date with Calculate live shows the register on any date. Historical month with View snapshot shows a month-end snapshot.
- Total value, Active assets, Written off and Month-on-month change.
- Value over time and Holdings by type.
- Assets lists every asset with its type, status, acquisition value and current value. Filter by Type and Status.
Allocation variance
How the actual split compares with the policy allocation.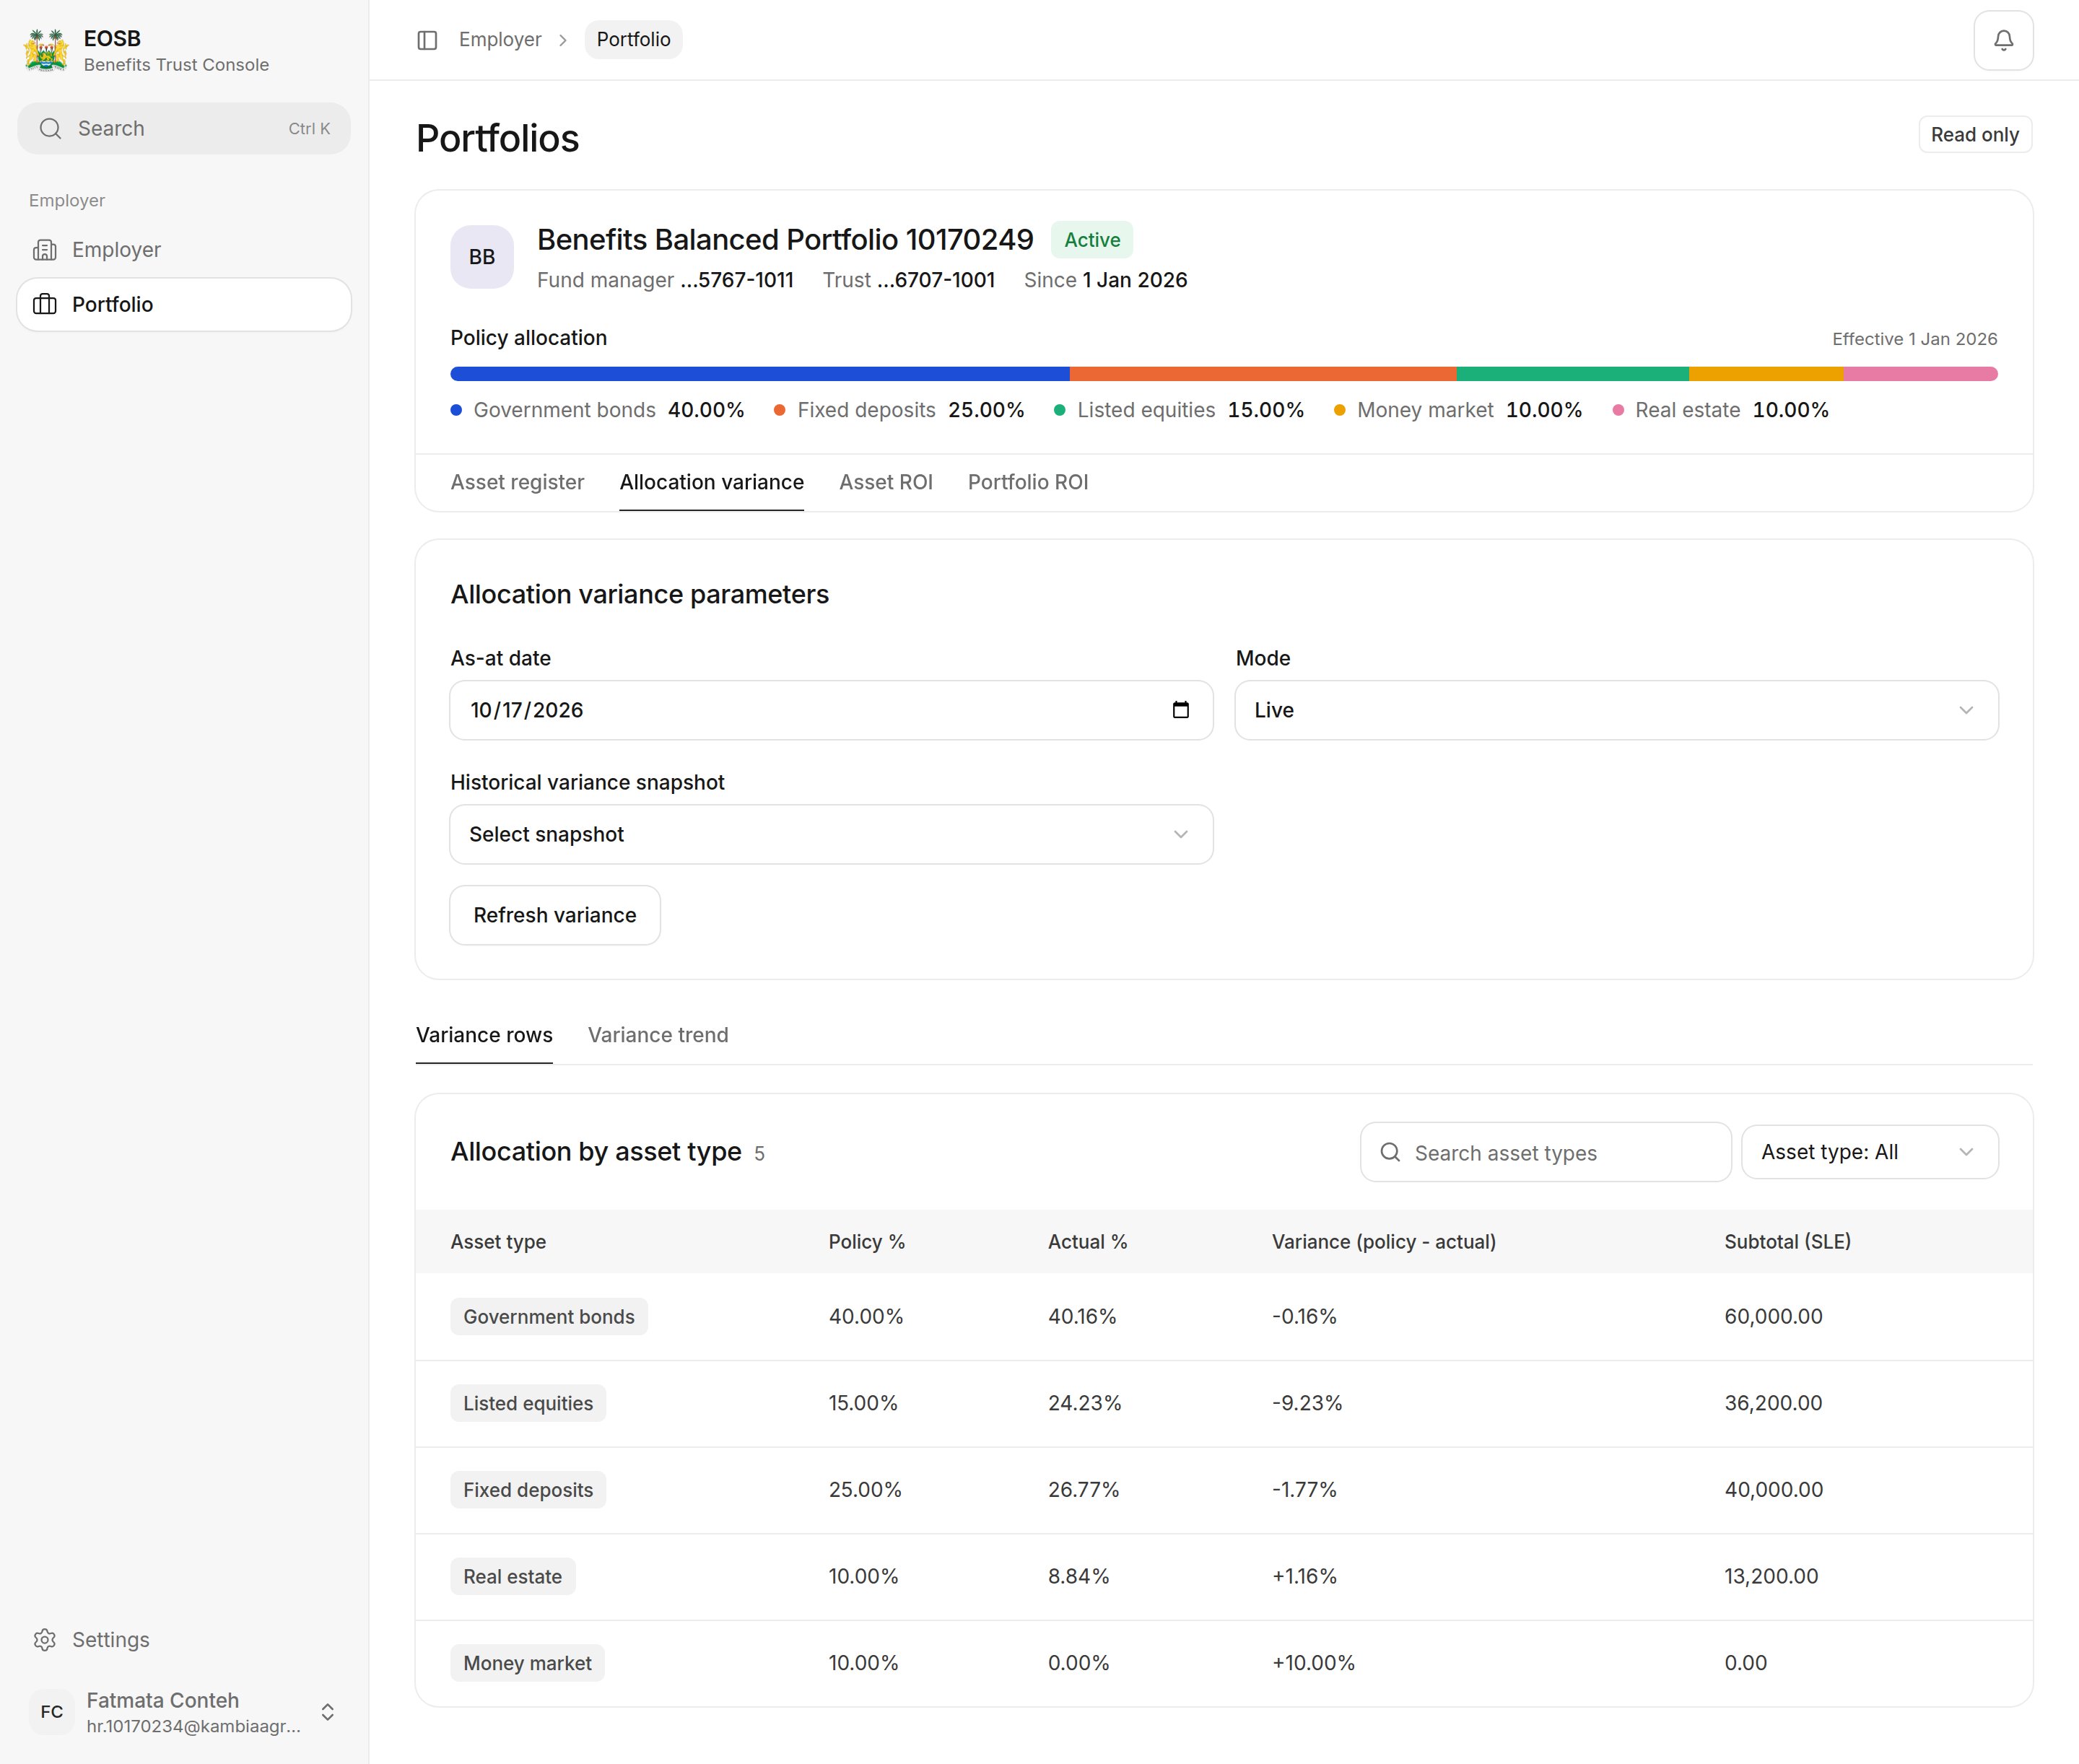
Allocation variance
Asset ROI
The return on one asset. Choose the Asset, an as-at date or snapshot, and select Refresh ROI.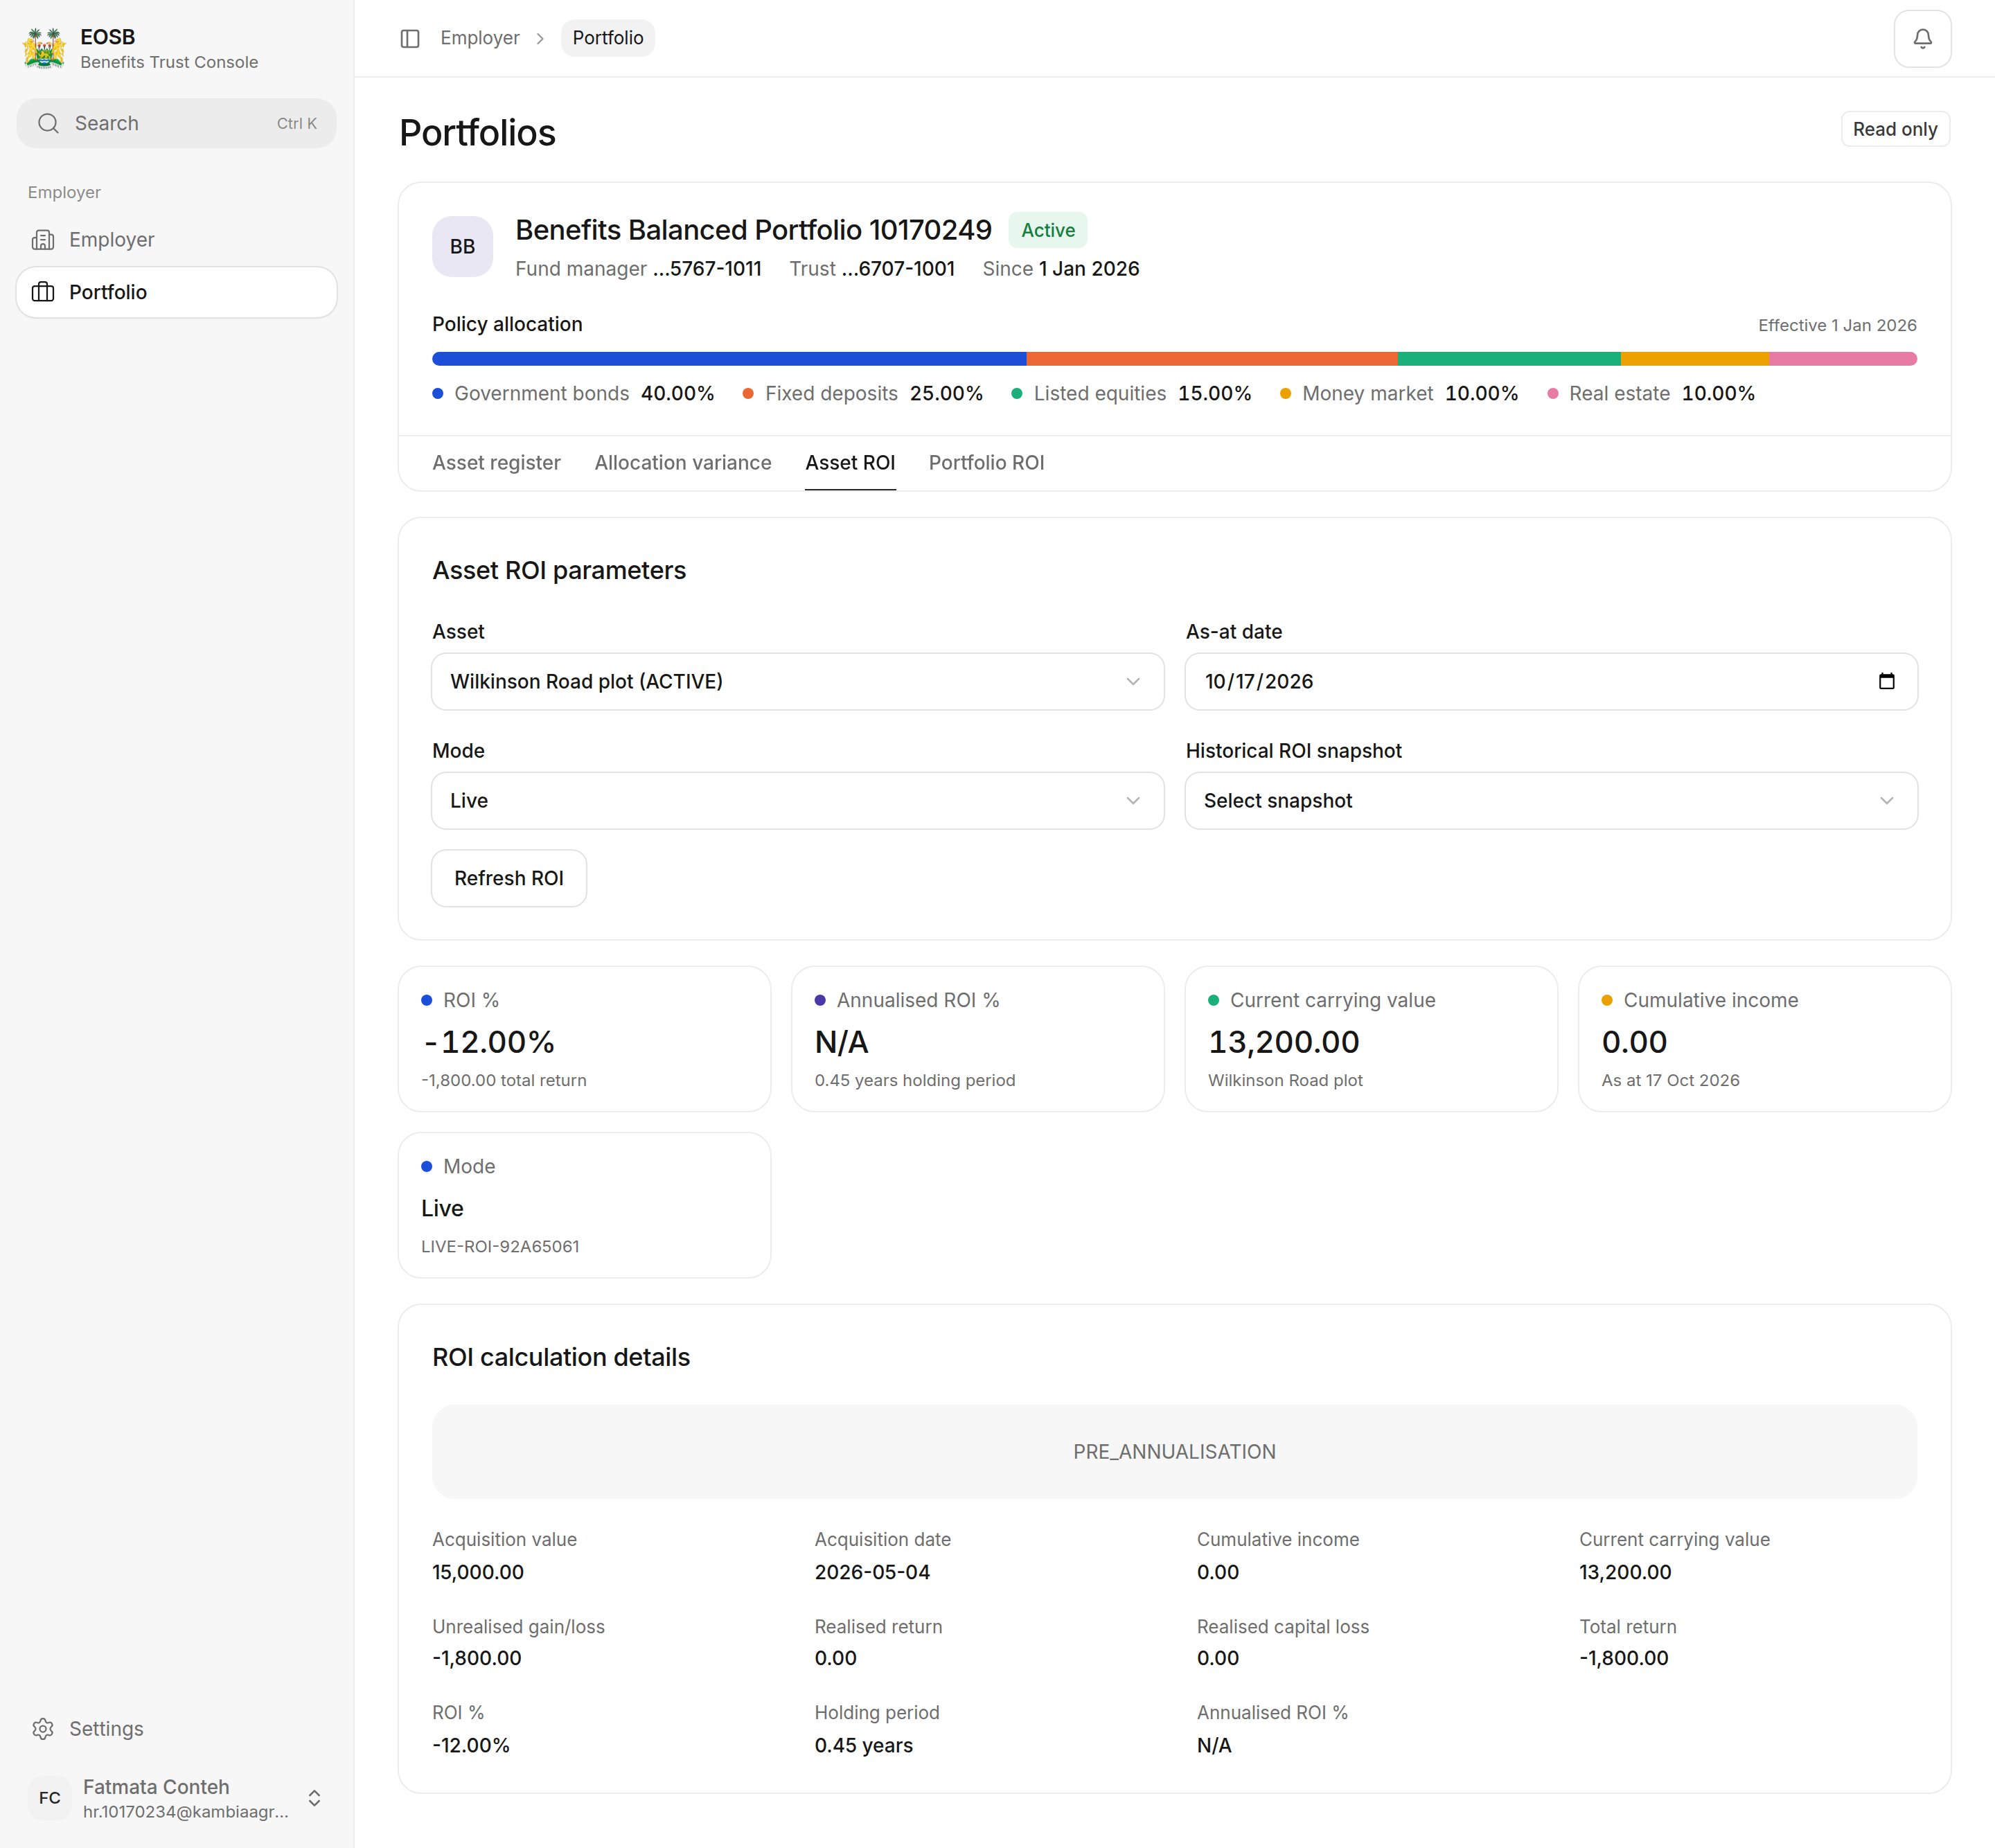
Asset ROI
Portfolio ROI
The return on the whole portfolio.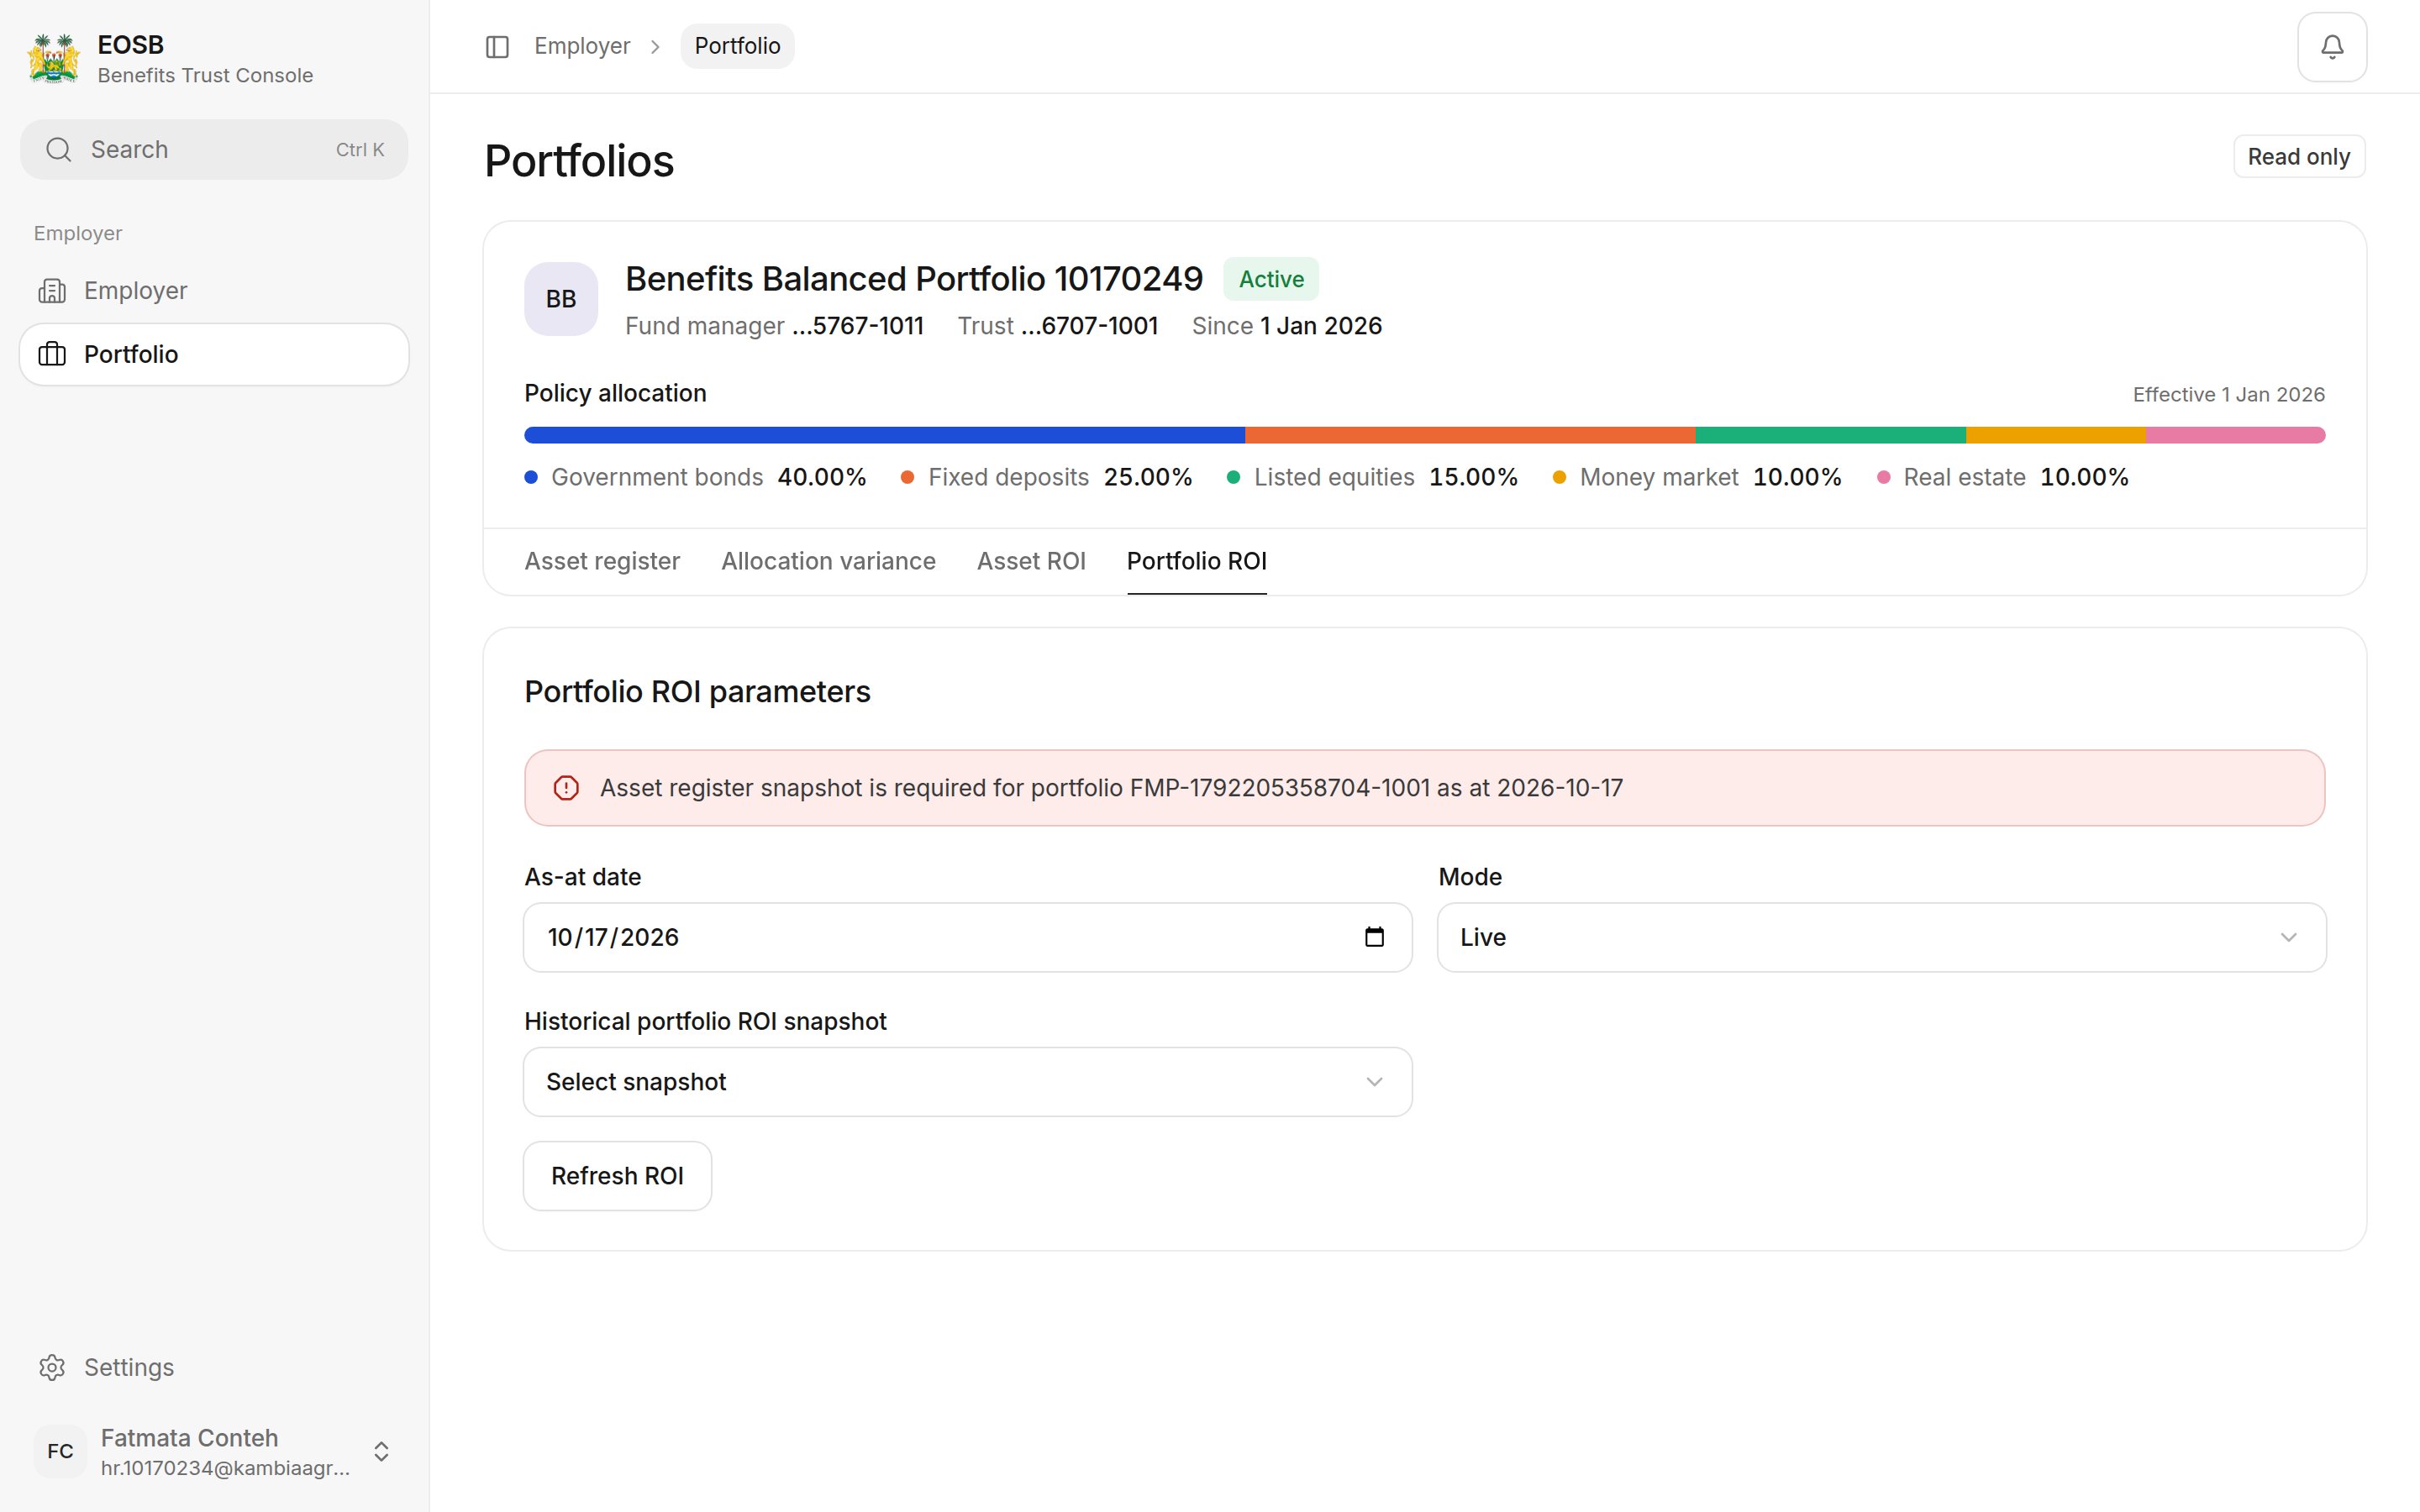
Portfolio ROI
Portfolio ROI is calculated from month-end asset register snapshots, so the page opens on the last month-end. To look at another month, choose its month-end date, or a snapshot from Historical portfolio ROI snapshot, and select Refresh ROI.