> ## Documentation Index
> Fetch the complete documentation index at: https://docs.eosb.org/llms.txt
> Use this file to discover all available pages before exploring further.
# Portfolio
> Follow how the fund manager has invested your trust's money. The page is read-only.
The portfolio shows what the fund manager has bought with your trust's money, and how it is performing. Investment income adds to your funded amount.
**Where:** **Portfolio** in the left-hand navigation. The page is marked **Read only**: the fund manager runs the portfolio and you follow it.
## Portfolio header
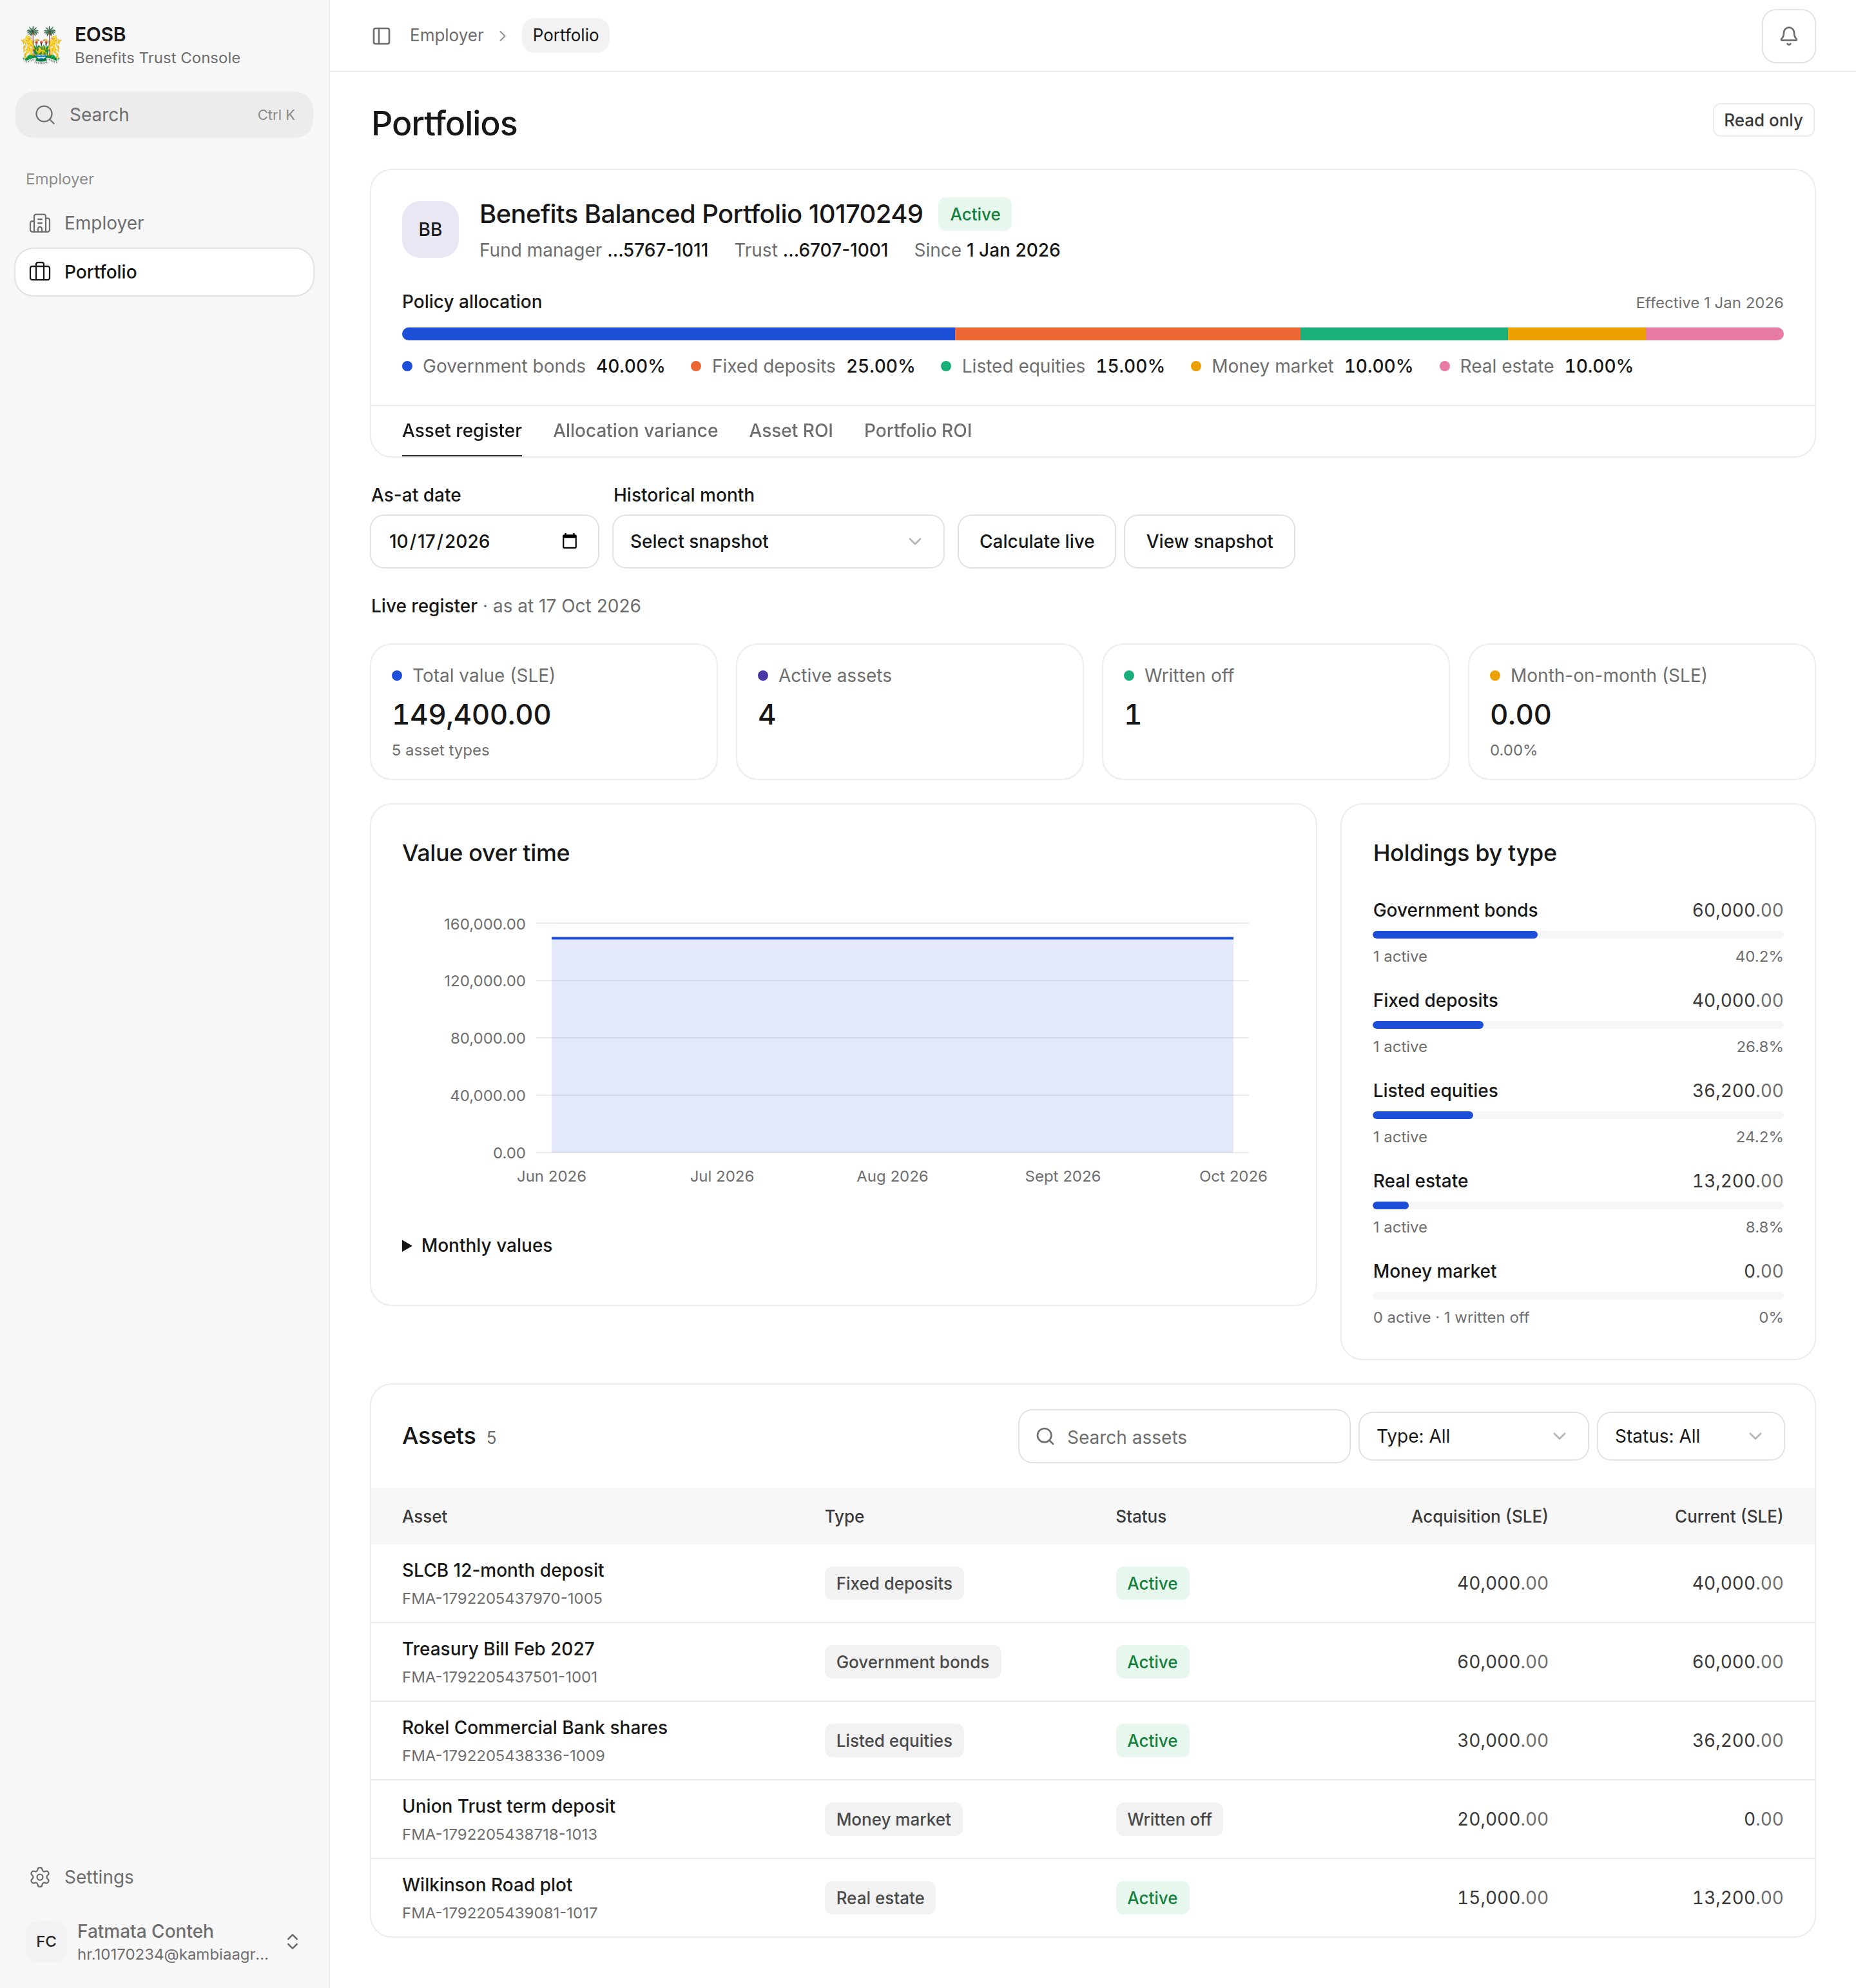 The header shows the portfolio name and status, its fund manager and trust, and the start date. **Policy allocation** is the agreed split of the money across asset types, for example 40% government bonds.
Under the header are four tabs.
## Asset register
What the portfolio holds.
* **As-at date** with **Calculate live** shows the register on any date. **Historical month** with **View snapshot** shows a month-end snapshot.
* **Total value**, **Active assets**, **Written off** and **Month-on-month** change.
* **Value over time** and **Holdings by type**.
* **Assets** lists every asset with its type, status, acquisition value and current value. Filter by **Type** and **Status**.
## Allocation variance
How the actual split compares with the policy allocation.
The header shows the portfolio name and status, its fund manager and trust, and the start date. **Policy allocation** is the agreed split of the money across asset types, for example 40% government bonds.
Under the header are four tabs.
## Asset register
What the portfolio holds.
* **As-at date** with **Calculate live** shows the register on any date. **Historical month** with **View snapshot** shows a month-end snapshot.
* **Total value**, **Active assets**, **Written off** and **Month-on-month** change.
* **Value over time** and **Holdings by type**.
* **Assets** lists every asset with its type, status, acquisition value and current value. Filter by **Type** and **Status**.
## Allocation variance
How the actual split compares with the policy allocation.
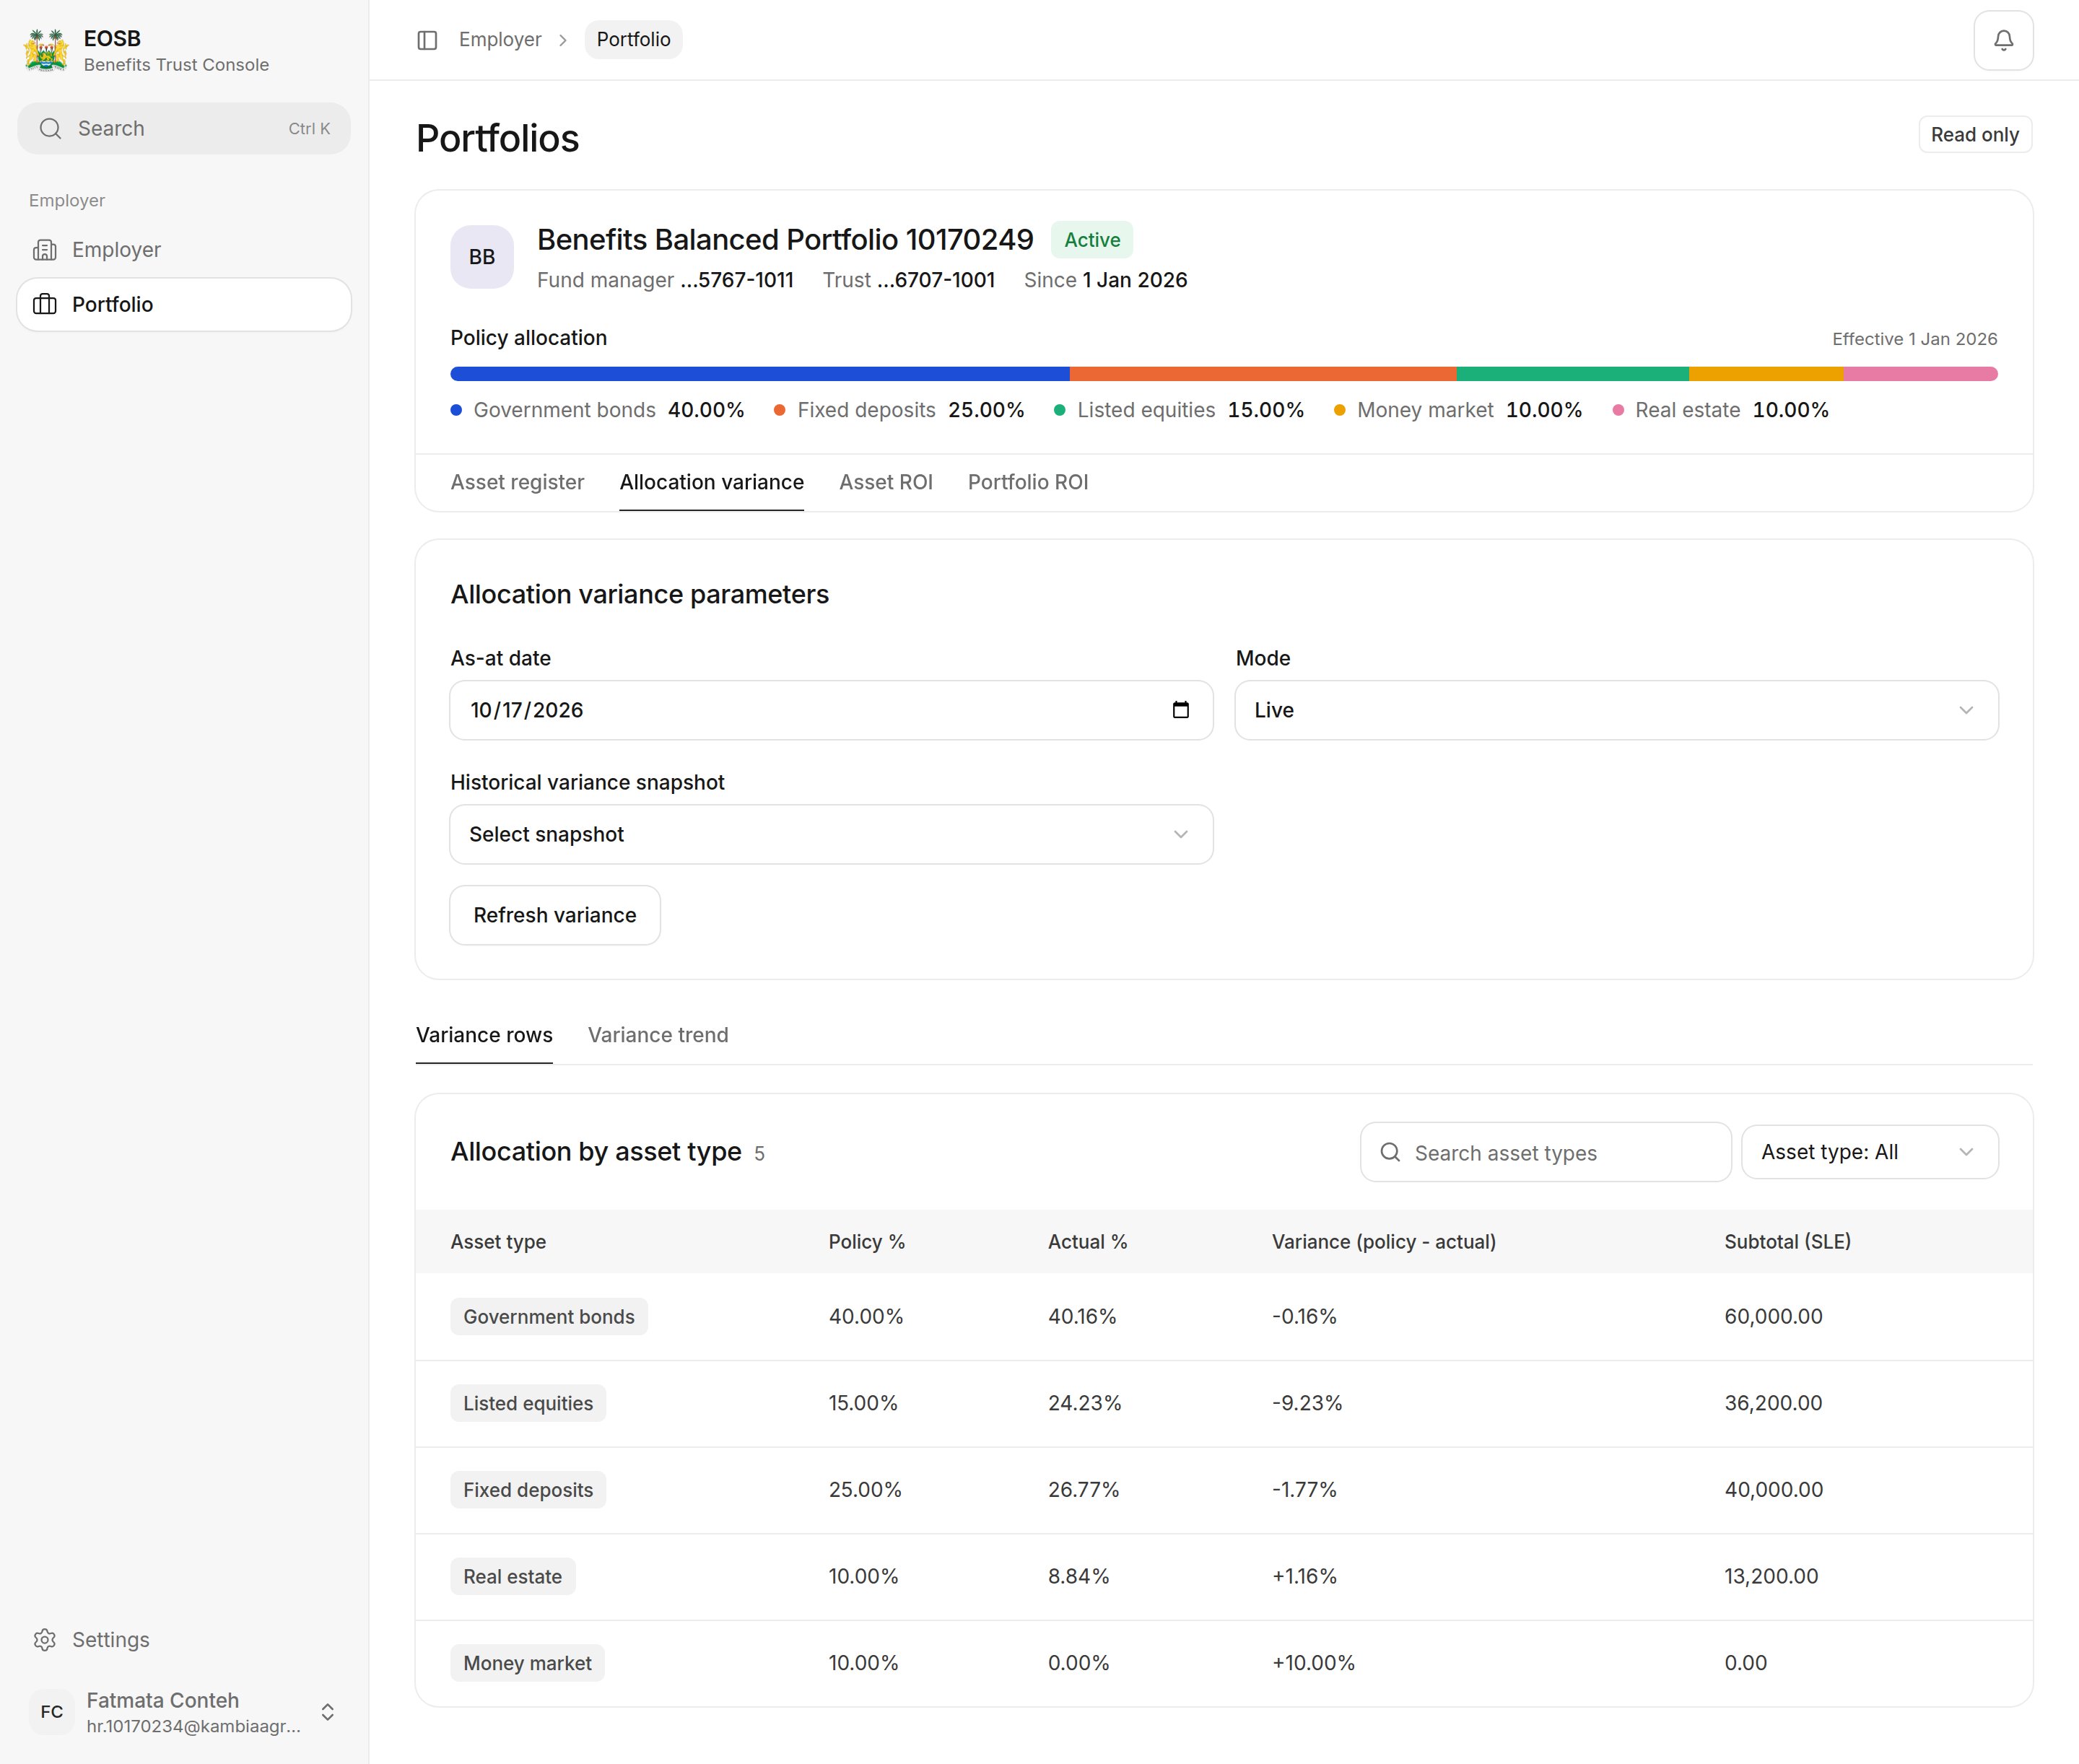 Each asset type shows its **Policy %**, **Actual %** and the **Variance**. Choose an as-at date or a historical snapshot and select **Refresh variance**. **Variance trend** shows the variance over time.
## Asset ROI
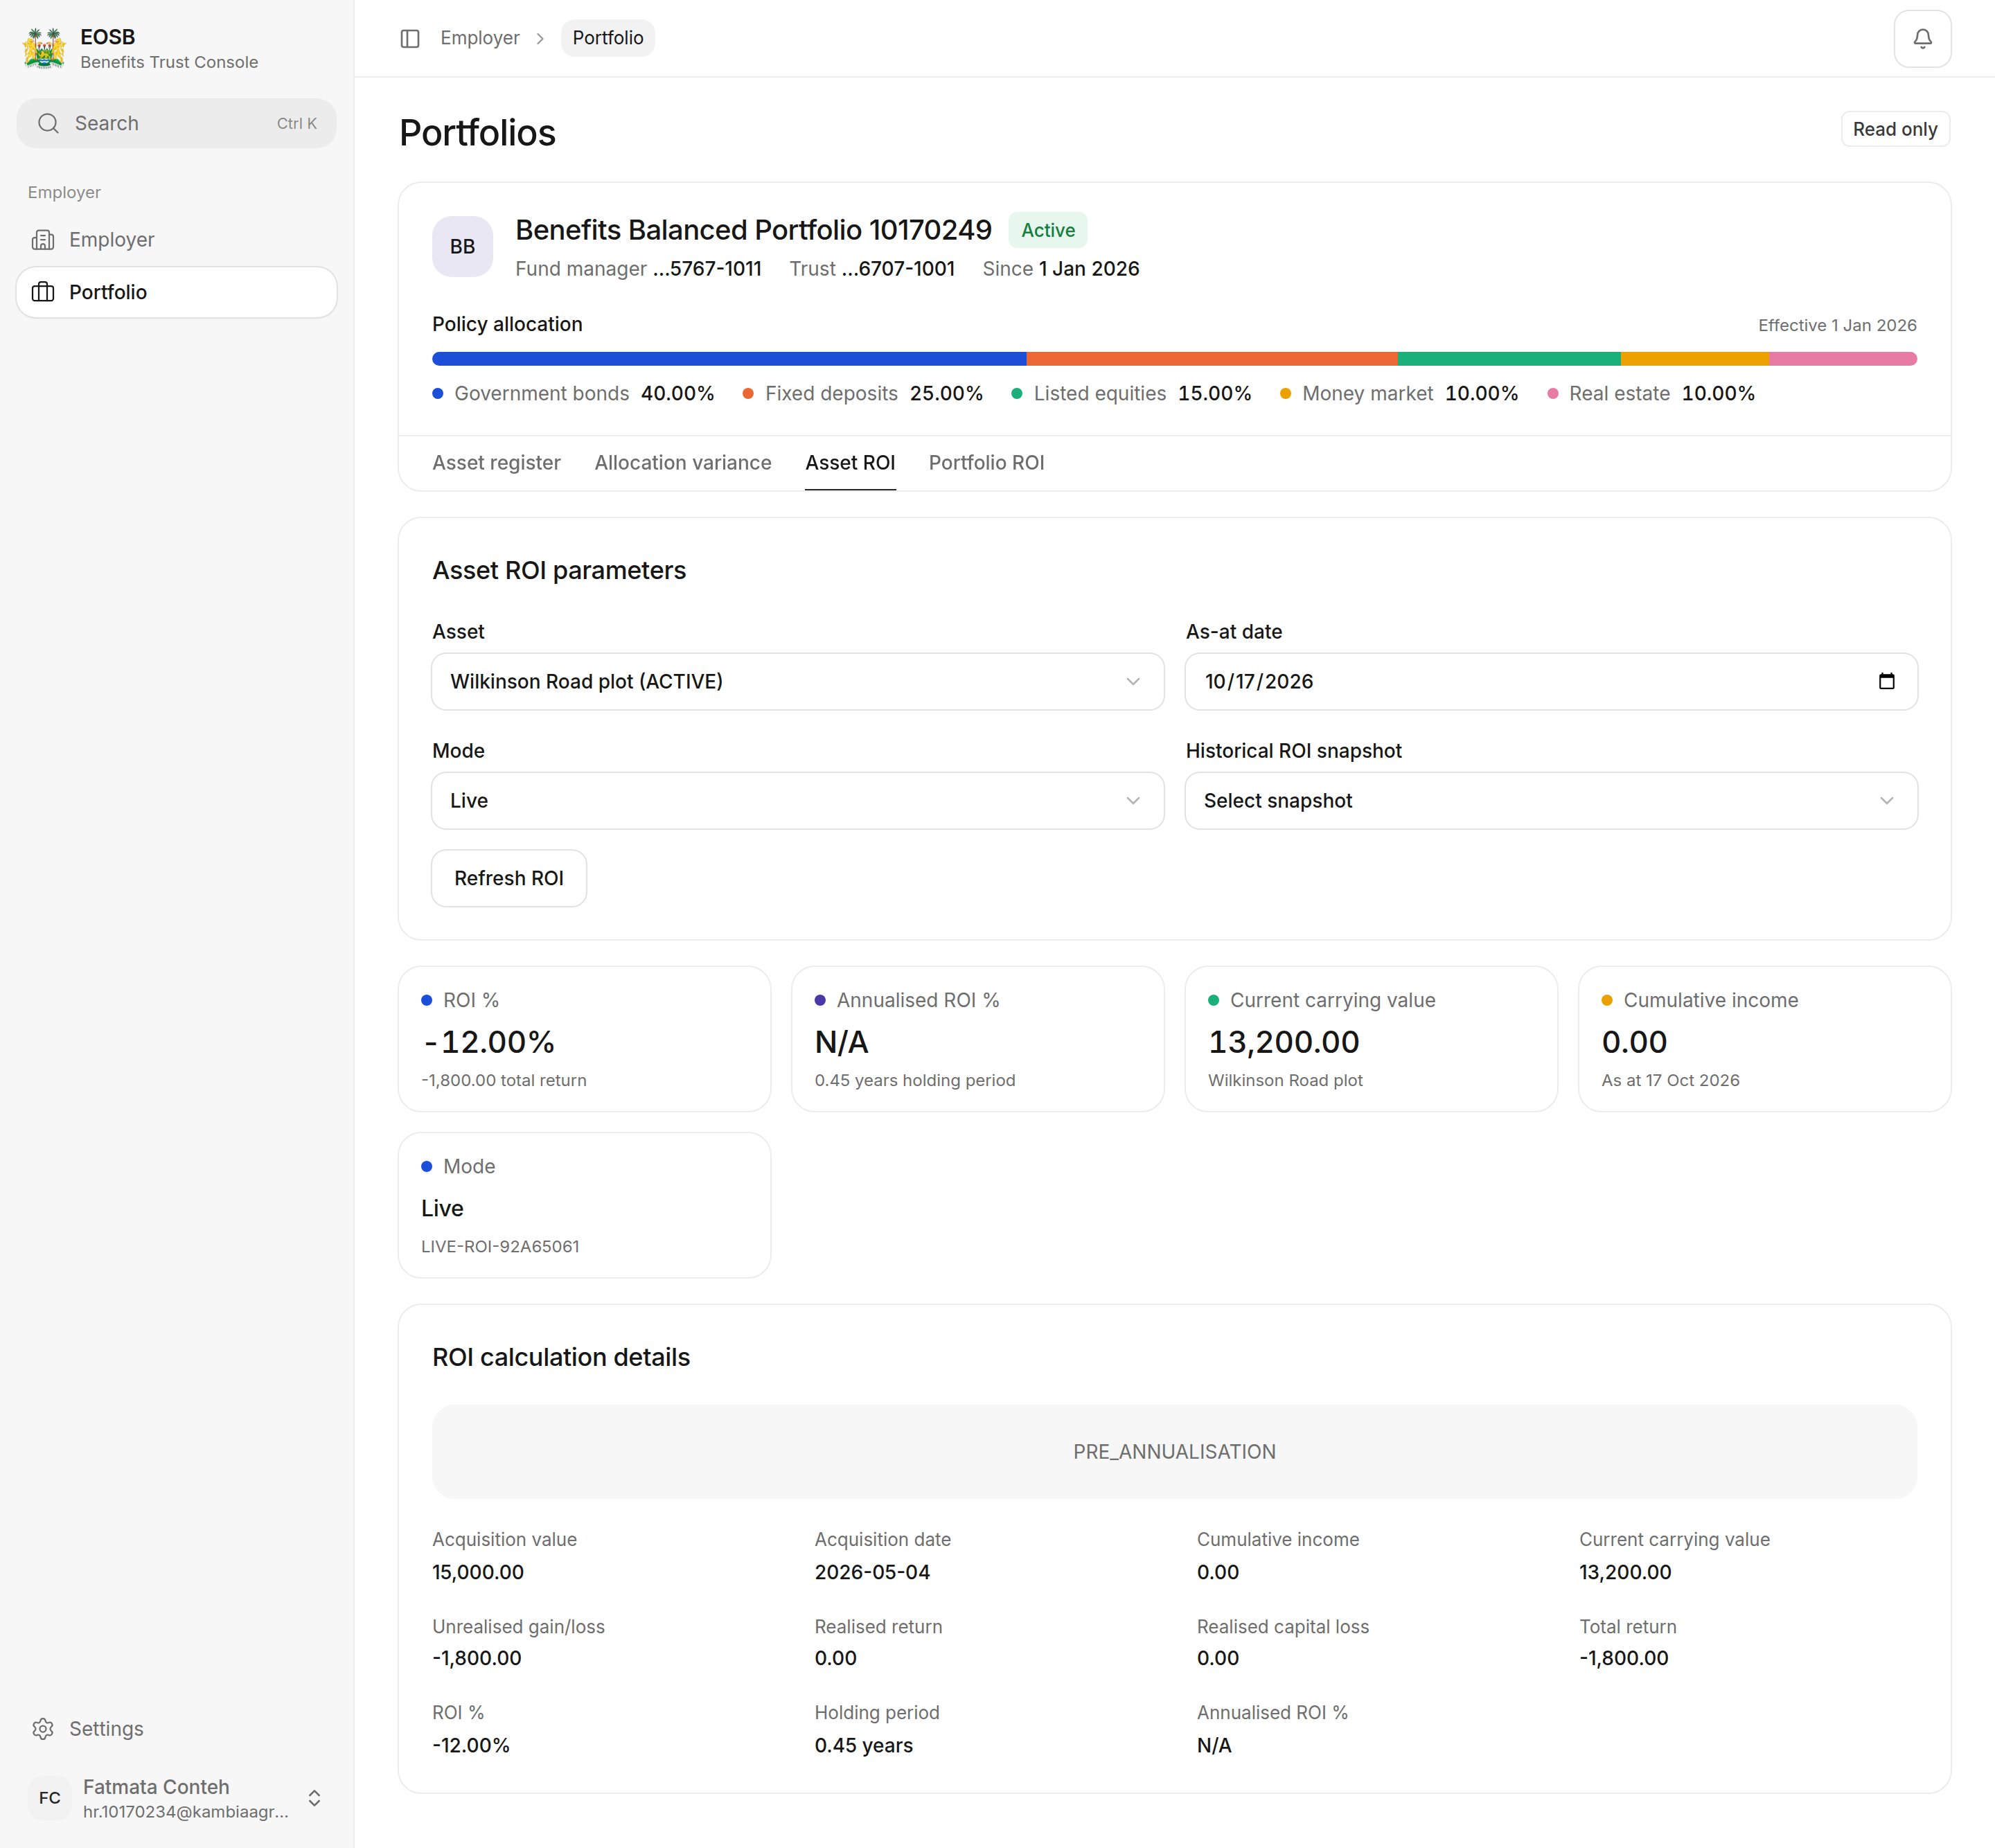
The return on one asset. Choose the **Asset**, an as-at date or snapshot, and select **Refresh ROI**.
Each asset type shows its **Policy %**, **Actual %** and the **Variance**. Choose an as-at date or a historical snapshot and select **Refresh variance**. **Variance trend** shows the variance over time.
## Asset ROI
The return on one asset. Choose the **Asset**, an as-at date or snapshot, and select **Refresh ROI**.
 ## Portfolio ROI
The return on the whole portfolio.
## Portfolio ROI
The return on the whole portfolio.
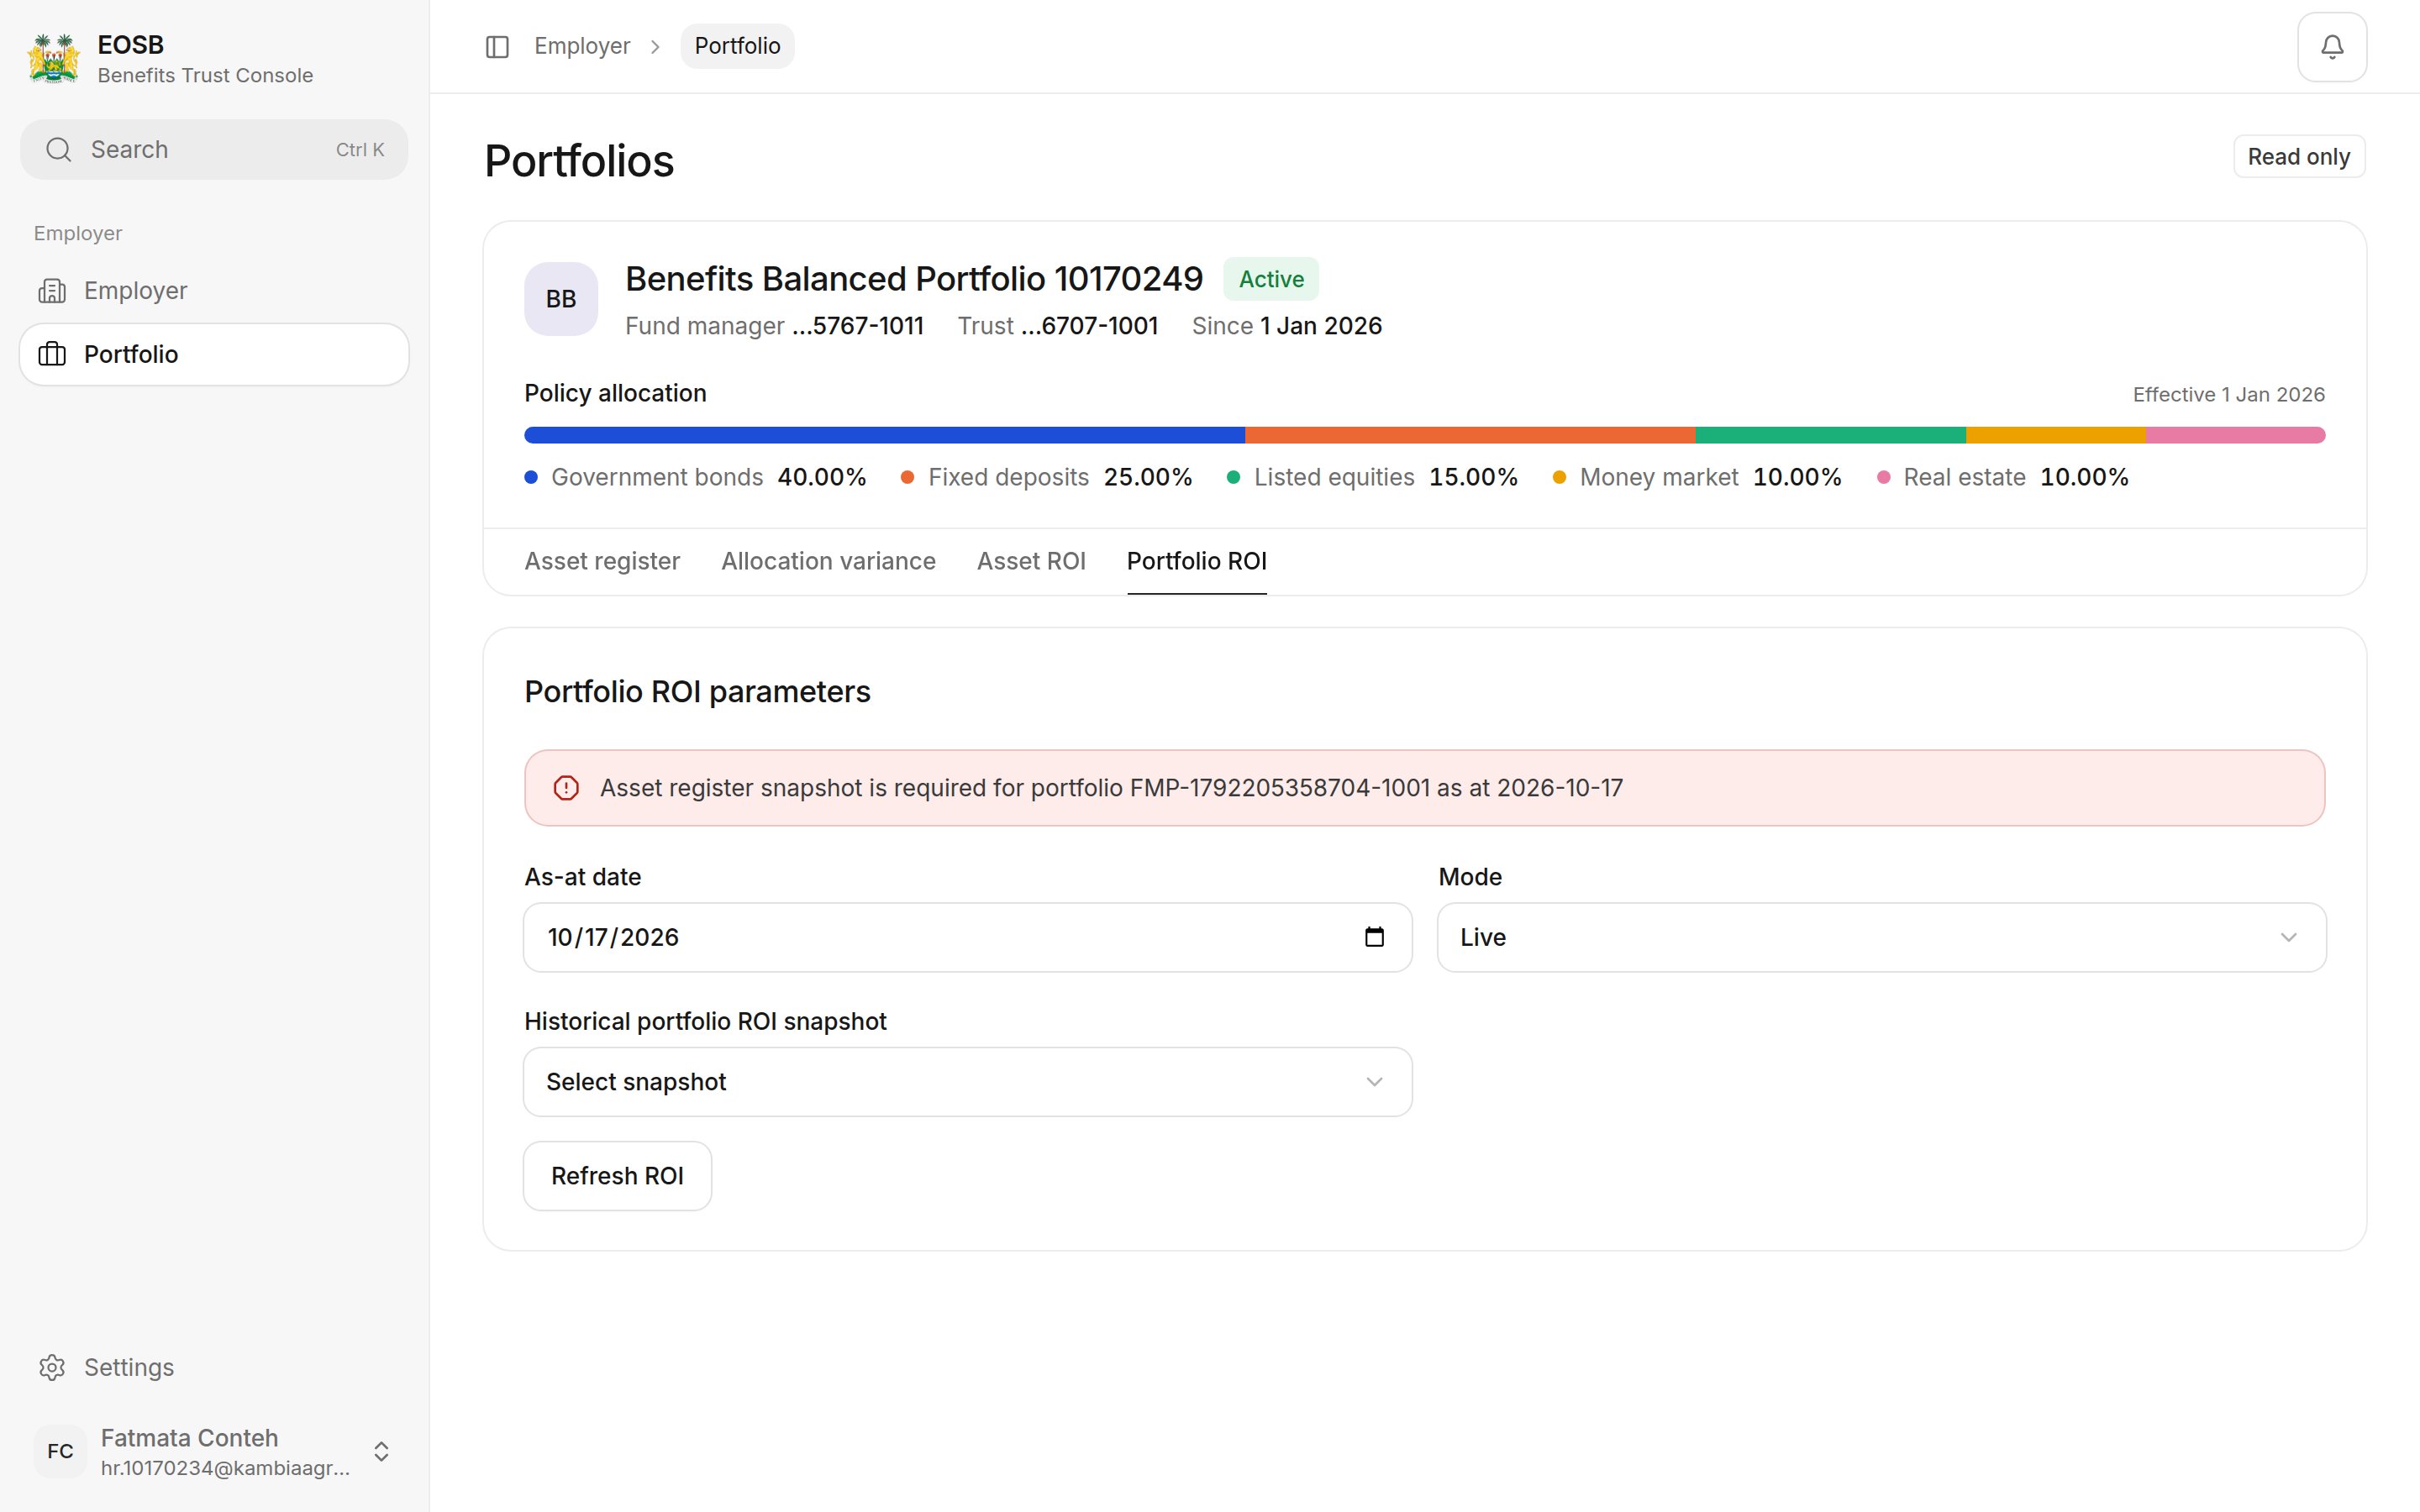 Portfolio ROI is calculated from month-end asset register snapshots, so the page opens on the last month-end. To look at another month, choose its month-end date, or a snapshot from **Historical portfolio ROI snapshot**, and select **Refresh ROI**.
This documentation is built and hosted on [Mintlify](https://mintlify.com), a developer documentation platform.
Portfolio ROI is calculated from month-end asset register snapshots, so the page opens on the last month-end. To look at another month, choose its month-end date, or a snapshot from **Historical portfolio ROI snapshot**, and select **Refresh ROI**.
This documentation is built and hosted on [Mintlify](https://mintlify.com), a developer documentation platform.